Quick answer
There is no universal good Solana wallet win rate. A rate above 50% can lose money when losses are larger than wins, while a 40% rate can be profitable with larger winners. Judge the denominator, payoff ratio, PnL, drawdown, evidence coverage, liquidity, and results after discovery.
What wallet win rate means
A Solana wallet win rate is the percentage of reviewed positions classified as profitable under a stated rule.
The basic calculation is:
win rate = profitable mature positions / all mature positions in the sample
Every word in that definition matters. You need to define a position, decide when it becomes mature, set the review period, and specify how open or unresolved positions are treated.
A wallet with 14 profitable positions out of 20 mature positions has a 70% win rate for that sample. It does not automatically have a 70% lifetime win rate. It also does not prove that following its next trade has positive expected value.
Why there is no single good percentage
Win rate ignores the size of each outcome. It also hides whether the sample is complete, whether current positions are liquid, and whether the wallet's entries were observable before prices moved.
Four wallets can display the same 60% win rate while having very different economics:
- one cuts losses quickly and lets winners run
- one collects small wins and occasionally takes a catastrophic loss
- one excludes open losers from the denominator
- one received profitable inventory by transfer with no covered acquisition basis
The percentage becomes useful only when paired with payoff and coverage.
Use expected return, not win rate alone
A simple expectancy model combines the probability and average size of wins and losses:
expectancy = (win rate × average win) + (loss rate × average loss)
Treat losses as negative values. This is a summary of the covered sample, not a forecast.
| Representative wallet | Win rate | Average win | Average loss | Sample expectancy |
|---|---|---|---|---|
| A | 70% | +8% | -22% | -1.0% |
| B | 40% | +35% | -8% | +9.2% |
| C | 58% | +14% | -11% | +3.5% |
Wallet A wins most often but loses money on average because its losses are too large. Wallet B loses more positions than it wins, yet its winners are large enough to create positive sample expectancy.
This is why a lower win-rate wallet can be the stronger candidate. The next questions are whether those averages survive fees, slippage, unresolved basis, and a later validation sample.
Add payoff ratio and break-even win rate
The payoff ratio compares the average winner with the absolute average loser:
payoff ratio = average winner / absolute average loss
A strategy with equal-sized wins and losses needs a win rate above 50% before costs. If the average winner is twice the average loss, the break-even win rate is about one third before costs. If the average loss is twice the average win, the wallet needs to win more than two thirds of positions before costs.
Fees, failed transactions, priority fees, price impact, and copy delay push the real break-even rate higher. Calculate from covered net outcomes rather than gross chart moves.
Define one position before counting wins
Solana activity does not arrive as a clean list of trades. One position can include several buys, transfers, routed swaps, LP movements, partial sells, and a remaining balance.
A practical token-level position begins when covered exposure rises from zero. It matures when one of these conditions is met:
- exposure returns to zero through covered disposals
- the predefined review horizon ends and the remaining inventory has a defensible value
- the position becomes unresolved because basis, ownership, quantity, or pricing cannot be reconstructed
Do not count each buy as a separate win. Do not count a partial sale as a closed winner while the wallet retains an unpriced bag.
Use the Solana transaction-history workflow to group signatures by economic sequence before assigning position outcomes.
Keep five outcome states
Use more than a binary win or loss:
- Covered winner: mature position with positive net return under the stated basis method.
- Covered loser: mature position with negative net return.
- Break-even: return falls inside the declared cost or rounding band.
- Open: exposure remains and the maturity rule has not been reached.
- Unresolved: basis, transfers, ownership, quantity, or value is materially incomplete.
Calculate the headline closed-position win rate from covered winners and covered losers. Show break-even, open, and unresolved counts beside it.
Moving difficult positions outside the denominator can make almost any wallet look successful. The excluded count is part of the result.
Check the accounting coverage first
A win label requires a defensible position result. Reconstruct:
- covered acquisition cost
- covered sale proceeds
- network, priority, and venue fees
- transferred-in and transferred-out lots
- remaining raw token quantity
- verified mint decimals
- current marked or executable value for open inventory
A transfer into the visible wallet is not a zero-cost acquisition. A transfer out is not a sale. If the basis moved through a related address, carry it only when common control and the lot path are supported.
The Solana wallet profitability guide provides a coverage-first method for realized PnL, unrealized PnL, ROI, and win rate.
Use a sample-size ladder
Sample size does not repair bad accounting, but a tiny clean sample still supports only a narrow conclusion.
Use this ladder as a research framework, not a universal statistical guarantee:
| Covered mature positions | Safe interpretation | Main risk |
|---|---|---|
| 1 to 5 | Anecdote or initial lead | One outcome dominates everything |
| 6 to 15 | Early candidate evidence | Large sampling error and strategy mixing |
| 16 to 30 | Useful style-specific sample | Regime and selection bias still matter |
| 31 to 100 | Stronger historical description | Old edge may have decayed after discovery |
| More than 100 | Rich behavior record | Aggregation can hide changing strategies |
Do not combine incompatible styles just to enlarge the sample. Early launch trades, multi-day accumulations, liquid large-cap rotations, and LP operations face different payoffs and failure modes.
A sample of 24 comparable launch positions can be more informative than 200 transactions that mix swaps, transfers, administrative actions, and unrelated strategies.
Separate discovery from validation
Many analysts find a wallet because of a visible winner, then include that same winner as proof of skill. This creates selection bias.
Use three windows:
- Discovery window: the activity that brought the wallet to your attention.
- Validation window: every qualifying position after the wallet was recorded.
- Live observation: the current action, compared with the validated style and current liquidity.
A 75% historical win rate can collapse to 42% after discovery. That does not prove the earlier data was false. It can mean the original sample selected a hot streak, the strategy changed, the market regime changed, or public observation eroded the edge.
Track both rates. Give more decision weight to the untouched validation window.
Report uncertainty without inventing precision
A displayed percentage is a point estimate from one covered sample. It is not the wallet's permanent probability of winning.
Use a resampling check when the covered outcomes are comparable. Repeatedly draw complete positions from the reviewed sample with replacement, then recalculate win rate and expectancy. Report the middle range of those recalculated results together with the method and sample size.
The purpose is not to create a magic confidence score. It is to expose fragile conclusions:
- a wide range means the sample does not pin down the rate well
- a range that crosses the break-even rate leaves economic quality unresolved
- a stable win-rate range with unstable expectancy points to payoff concentration
- a narrow historical range can still fail in the untouched validation window
Keep unresolved and open positions outside the resampling pool, but show their counts beside the result. Do not silently classify them to narrow the range.
Compare wallets inside the same strategy
A good benchmark uses relevant peers rather than one sitewide threshold.
Group candidates by:
- token age at entry
- market-cap and liquidity range
- average holding period
- typical position size
- launch, momentum, accumulation, or distribution style
- use of scheduled orders or repeated manual buys
- time period and market regime
Then compare win rate, payoff ratio, median return, drawdown, coverage, and liquidity inside that cohort.
The smart-money wallet guide explains how to keep strategy fit, funding independence, current exposure, and executability beside performance.
Watch for one-winner concentration
A wallet can have positive total PnL while most of its edge comes from one exceptional position. Record:
- largest winner as a share of total profit
- top three winners as a share of total profit
- median return
- average return with and without the largest winner
- longest losing streak
- maximum covered drawdown
If removing one trade changes the sample from profitable to losing, describe the result as concentrated. It may still be genuine, but it is less evidence of a repeatable process.
Adjust for liquidity and follower execution
The source wallet's win rate is not your win rate.
A wallet may enter before a token appears in a public feed. Your later entry can face a higher price, thinner remaining depth, greater slippage, and the source wallet already distributing.
For each candidate position, record:
- source-wallet execution time and price
- observation time
- realistic follower quote time and price
- intended follower size
- route output, price impact, and fees
- source-wallet sales during the delay
- full-size exit quote at the review checkpoint
Recalculate the sample with follower prices. A historically profitable wallet can become uncopyable even while its original win rate remains accurate.
Use Solana liquidity-removal analysis when a position's marked value depends on thin or changing pool depth.
Example: evaluating a representative wallet
Consider an anonymized launch trader reviewed across 28 mature positions:
- 16 covered winners
- 10 covered losers
- 2 break-even positions
- 4 additional open positions outside the mature denominator
- 3 unresolved transfers outside the covered sample
- average winner of 14%
- average loss of 11%
- one winner contributes 38% of total profit
- median holding period of 2.7 hours
Excluding break-even positions, the covered win rate is 16 out of 26, or about 61.5%. Including them as non-wins produces 16 out of 28, or about 57.1%.
The rate is promising but not sufficient. The sample has positive payoff asymmetry, yet one winner contributes heavily and seven additional positions are open or unresolved. The next step is an untouched validation sample and follower-price simulation.
Do not publish one percentage without the denominator rule. Both 61.5% and 57.1% can be calculated honestly from the same record, but they answer slightly different questions.
What Stalkchain can prove in the workflow
The public Smart Money Transactions page helps discover active Solana addresses. On September 8, 2026, the production route displayed populated rows dated September 7 with date, time, wallet, sold asset, bought asset, and USD value.
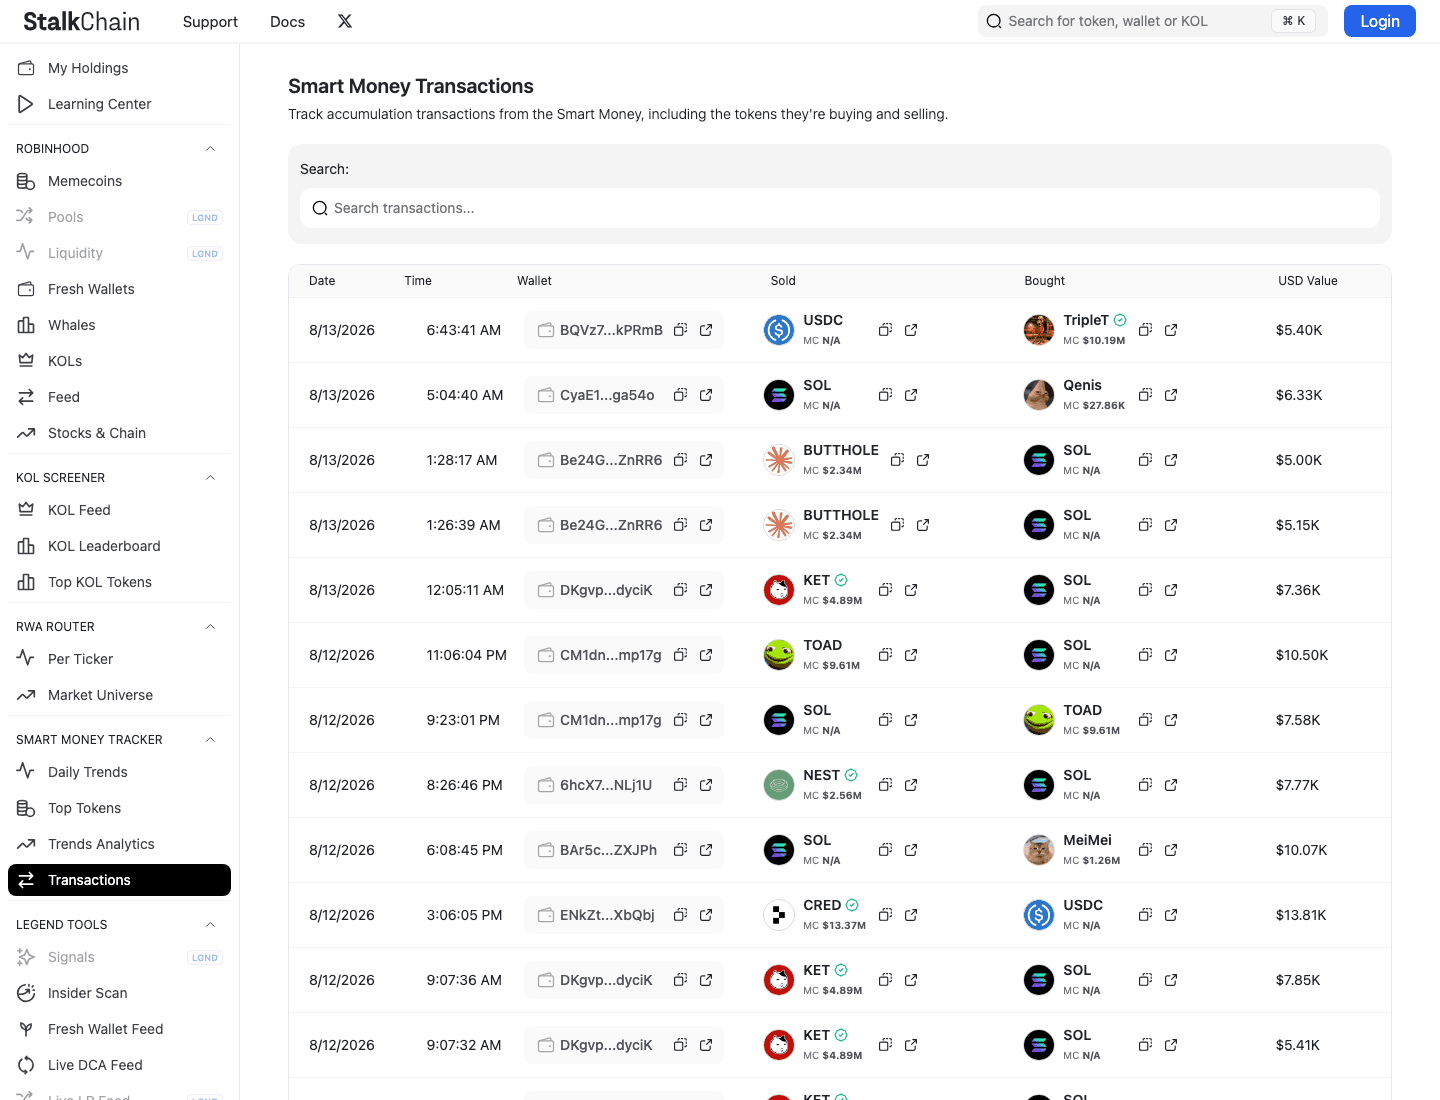
The screenshot is an August 13 production capture of the same discovery fields. It does not show a wallet's full history, complete position denominator, basis, transferred inventory, fees, or current exit liquidity.
Use Transactions to find a lead and KOL Feed when public attribution is relevant. Then open the full address and signatures in a compatible Solana explorer. Build the position ledger before calculating win rate.
The product shortens discovery. It does not turn one row or public label into a performance audit.
Healthy and risky win-rate evidence
Healthier evidence
- The position definition and maturity rule are fixed in advance.
- Winners, losers, break-even, open, and unresolved counts are visible.
- Basis, transfers, fees, decimals, and remaining inventory reconcile.
- Payoff ratio, median return, drawdown, and total PnL accompany win rate.
- Comparable wallet styles are benchmarked separately.
- An untouched validation sample supports the historical result.
- Follower-price simulation remains positive at the intended size.
Riskier evidence
- The rate has no denominator or review period.
- Each buy is counted as a separate winning trade.
- Open losers and transferred-out inventory disappear.
- Sale proceeds are treated as profit despite missing basis.
- One exceptional winner drives the record.
- Several related wallets are counted as independent confirmation.
- The token cannot support a realistic follower entry and exit.
Common false positives
Selected winners: The sample begins after the wallet became famous and omits earlier losses.
Open-bag exclusion: Profitable closed positions count, while underwater open positions do not appear anywhere.
Transferred basis: Inventory arrives from another address, making the visible wallet's acquisition cost look like zero.
Position splitting: Several partial buys or sells are counted as separate favorable outcomes.
Illiquid marks: A spot price labels an open position profitable even though the full quantity cannot exit near that value.
Actor duplication: Sibling wallets funded and controlled by one actor appear as several successful traders.
Regime mixing: A wallet's liquid-token record is used to validate a thin new-launch trade.
Copy delay: The source wins at its price, while observers enter after the favorable part of the move.
Final checklist
- Define the wallet strategy before benchmarking it.
- Fix the review period and maturity rule.
- Group signatures into economic positions.
- Show the numerator and denominator.
- Show break-even, open, and unresolved counts.
- Reconstruct basis, transfers, fees, and inventory.
- Calculate payoff ratio and sample expectancy.
- Compare median return, drawdown, and total covered PnL.
- Measure profit concentration in the largest winners.
- Separate discovery and validation windows.
- Collapse related wallets before counting confirmation.
- Recalculate outcomes using realistic follower prices.
- Check entry and exit liquidity at the intended size.
- Preserve the exact address, signatures, and observation time.
- Report a reproducible uncertainty range for sufficiently large comparable samples.
FAQ
Is a 70% Solana wallet win rate good?
It can be, but the percentage is not enough. Check the number of mature positions, average win and loss, total PnL, drawdown, open positions, unresolved basis, and whether the result survives an untouched validation period.
Can a wallet be profitable with a 40% win rate?
Yes. A 40% win rate can be profitable when average winners are sufficiently larger than average losses after fees and slippage. Use sample expectancy and total covered PnL to verify the economics.
Should open positions count in wallet win rate?
Keep them visible, but do not mix them silently with closed positions. A closed-position rate should exclude open positions and state the excluded count. A marked total-sample rate must state its pricing and liquidity assumptions.
How many trades are enough to judge a Solana wallet?
There is no universal minimum. A larger fixed sample is stronger, but only when the positions are comparable and accounting coverage is sound. Five trades are anecdotal. Dozens of covered, style-consistent positions plus a later validation sample provide stronger evidence.
Is win rate more important than wallet PnL?
No. Win rate measures frequency. PnL measures economic result. Payoff ratio, median return, drawdown, sample size, coverage, and liquidity explain whether either headline is reliable.
Can I copy a wallet with a high win rate?
Not safely from the rate alone. Model your detection delay, entry quote, intended size, exit depth, fees, and the source wallet's distribution. A good source trade can become a bad follower trade.