Quick answer
To investigate whale accumulation on Robinhood Chain, use the Stalkchain whale tracker to find trade-derived unsold balances, then compare net tokens, net USD spent, average cost, estimated position, and last activity.
Open the wallet and classify every material flow. The strongest signal is repeated net buying through real swaps while exposure remains consolidated and executable liquidity can support a plausible exit.
Transfers, bridge receipts, LP withdrawals, contract deposits, and low-liquidity marks can create false accumulation signals.
What whale accumulation actually means
Whale accumulation is a sustained increase in a large holder's economic exposure to an asset. It is not merely an increase in the number of tokens displayed at one address.
A useful working definition requires three conditions:
- The wallet or wallet cluster acquired net exposure. Tokens entered through purchases or another transaction that genuinely increased ownership.
- The exposure remained after related outflows. Transfers to sister wallets, LP contracts, staking contracts, or deposit addresses must be reconciled.
- The position is meaningful at executable prices. A quoted valuation based on a thin pool may overstate what the whale could actually sell.
For broader network context, start with what Robinhood Chain is.
For address-level investigation, use the companion guide to tracking wallets on Robinhood Chain.
Read the native accumulation leaderboard first
The Robinhood Chain whale tracker ranks wallets by net USD spent through pools. You can switch between all-time and seven-day windows, filter to one token, and raise the minimum net-spend threshold.
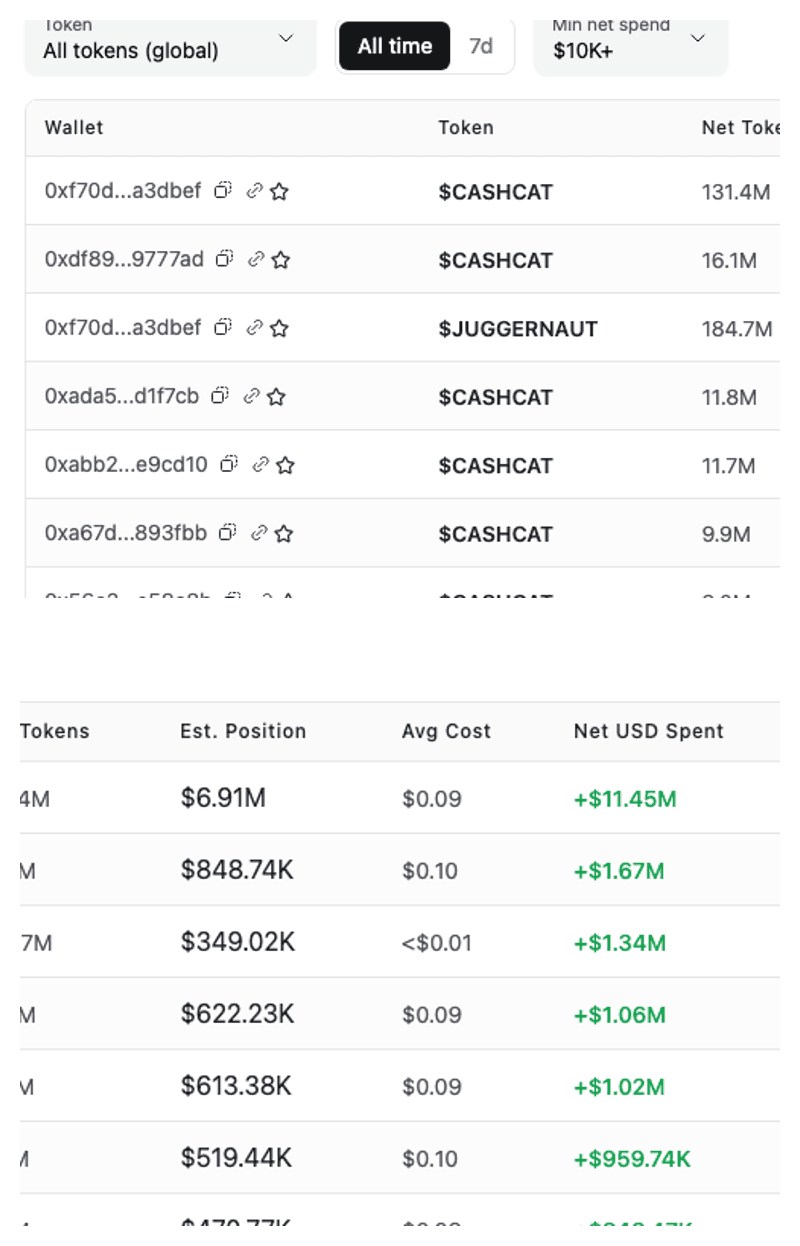
Stacked reading crops from one live product capture on July 24, 2026. Estimated positions change with live prices. Rows without a verifiable price are deliberately shown as unverified rather than assigned a paper value.
Use the columns as a sequence:
- Net USD spent establishes whether the wallet put more quote value into buys than it recovered from sells.
- Net tokens shows the remaining trade-derived token balance.
- Average cost gives an entry reference, not a guaranteed tax or accounting basis.
- Estimated position marks the unsold balance only when a defensible live price exists.
- Last activity separates active accumulation from an old dormant position.
In the live capture, the top address appeared in several token rows. That repeated address is a portfolio clue, not several independent confirmations. Drill into the wallet before treating cross-token rows as broad market conviction. To see which Robinhood Chain tokens several traders bought, use the multi-trader view instead of one wallet's rows.
Why EVM activity is easy to misread
A single Robinhood Chain transaction can call a router, cross several contracts, emit multiple token transfers, wrap or unwrap ETH, and return residual assets to the sender.
Looking only at the top-level transaction or the final Transfer event removes the economic context.
Before calling an inflow a buy, distinguish these activity types:
- Swaps: The wallet exchanged one asset for another through a DEX router, aggregator, or pool. This can represent genuine accumulation.
- Transfers: Tokens moved between addresses without a market exchange. The recipient's balance rose, but the owner may not have increased exposure.
- LP activity: Adding liquidity sends assets out of the wallet; removing liquidity brings them back. Neither action alone is a conventional buy or sell.
- Bridging: A bridge receipt can create a large on-chain inflow even though the user acquired the asset elsewhere or simply moved it between chains.
- Contract deposits: Tokens sent to a vault, staking contract, lending market, or smart account can make one address fall while another rises without changing beneficial ownership.
- CEX or bridge funding: ETH or stablecoin funding from a centralized exchange or bridge can precede a buy, but funding itself is not accumulation.
- Split-wallet activity: One operator may distribute purchases across several fresh addresses, then consolidate, or transfer an old position into those addresses to simulate new buyers.
The correct unit of analysis is often the wallet cluster, not one address.
Separate capital preparation from token accumulation
A newly funded wallet can be worth monitoring before it buys anything, but funding and accumulation answer different questions.
- Funding answers: did usable capital arrive, from where, and how concentrated was the source?
- Accumulation answers: did the wallet exchange consideration for the target asset and retain net economic exposure?
- Distribution answers: did the same wallet or a related address reduce exposure elsewhere?
Keep those states separate in your notes. A wallet that receives 200 ETH from a bridge has imported capital. It has not accumulated a memecoin until the subsequent asset flows support that conclusion.
A funding-to-action funnel
For each large first deposit, follow this sequence:
- Confirm the wallet had no earlier meaningful outbound chain activity.
- Classify the source as a bridge, exchange, private wallet, treasury, contract, or unresolved origin.
- Measure the delay between funding and the first economically relevant action.
- Classify that action as a swap, liquidity provision, transfer, deployment, approval, or bridge movement.
- Check whether the source funded other new wallets in the same period.
- Reconcile the cluster's later buys, sells, transfers, and current exposure.
The most useful signal is not “a fresh wallet received a large amount.” It is a sequence such as private funding, prompt market buys, retained exposure, and repeated independent-looking demand that survives cluster checks.
Patterns that weaken the signal
- The source is a shared exchange or bridge and no other relationship evidence exists.
- The address only forwards funds to another wallet.
- Several wallets receive uniform amounts, then interact in lockstep.
- Visible buys are smaller than sales from a linked address.
- The wallet supplies removable liquidity instead of retaining straightforward spot exposure.
- The token's executable depth cannot support the displayed position.
Use the full Robinhood whale-tracking workflow to group large transfers, newly funded wallets, and multisig activity without double-counting transaction legs.
A repeatable workflow for verifying accumulation
1. Fix the asset, window, and chain
Confirm the token contract rather than relying on its ticker. Record the start and end of the observation window and verify that the transactions are on Robinhood Chain, chain ID 4663.
Use the same window for every wallet you compare. A seven-day inflow measured against a 24-hour outflow produces a misleading result.
2. Establish the opening position
Record the wallet's token balance immediately before the first suspected accumulation event. Include economically related positions where possible:
- wallet-held tokens;
- claimable or deposited tokens in known vaults;
- LP exposure attributable to the wallet;
- wrapped or receipt-token representations;
- balances held in linked smart accounts.
This gives you a defensible baseline instead of treating the current balance as the entire story.
3. Classify each material transaction
For every large balance change, inspect the transaction receipt, logs, called contracts, and asset flows. Ask a simple question: what did the wallet give up to receive these tokens?
A swap should show consideration leaving the wallet or cluster, such as ETH, WETH, or a stablecoin. A plain transfer may show no corresponding payment.
An LP withdrawal should return two pool assets or follow the burning of an LP position. A bridge receipt should involve a recognized bridge path and a corresponding cross-chain action.
Do not infer intent from a contract name alone. Proxies, routers, and multicalls can obscure the final action.
4. Build the likely wallet cluster
Look for repeated relationships rather than declaring common ownership from one transfer. Useful cluster clues include:
- the same funding source;
- coordinated funding amounts and timing;
- repeated transfers among the addresses;
- identical router, approval, and gas patterns;
- synchronized buys or sells;
- consolidation into one destination;
- a shared CEX withdrawal or bridge source followed by coordinated behavior.
CEX and bridge addresses serve many unrelated users, so a shared source is weak evidence by itself. Combine several clues before aggregating wallets.
For a detailed process, see how to track Robinhood Chain whale wallets.
5. Calculate cluster-level balance delta
Use a simple reconciliation:
Net balance delta = ending balance − opening balance
Then separate that delta into economic categories:
Net acquired exposure = swap buys − swap sells ± exposure-changing protocol actions
Internal transfers inside the cluster should net to zero. Bridge receipts and transfers from outside the cluster should be labeled separately because they do not prove where or when the asset was purchased.
If a whale buys 2 million tokens in one address and transfers 1.5 million to a second controlled address, the cluster accumulated 2 million, not 3.5 million.
6. Reconstruct cost and acquisition quality
Estimate the consideration paid for genuine purchases, including fees and material price impact. Then compare:
- volume-weighted average entry price;
- current cluster balance;
- realized sales;
- unrealized exposure;
- time between buys and transfers;
- whether purchases occurred across several independent blocks and pools.
Repeated buys at rising prices can indicate conviction, but they can also be price support or self-directed activity. The surrounding flow still matters.
Compare your reconstruction with the tracker fields. A large gap between net USD spent and estimated position may reflect price movement, incomplete pricing, liquidity constraints, or a basis issue. Investigate the gap instead of turning it into an automatic bullish or bearish label.
7. Test executable liquidity
Market value is not the same as exit value. Inspect the pools that can actually absorb a sale and consider depth, concentration, route quality, slippage, and whether liquidity can be withdrawn by a small number of providers.
A wallet marked as holding $1 million of a token may be unable to sell even a fraction near the displayed price.
When analyzing a speculative asset, pair wallet analysis with Robinhood Chain memecoin analysis to evaluate pool structure and holder concentration.
8. Monitor what happens next
Accumulation is a behavior over time, not a screenshot. Set checkpoints and watch for:
- continued market buys;
- transfers to new linked wallets;
- approvals to routers or protocol contracts;
- deposits into LP, staking, or lending positions;
- test sells before larger exits;
- transfers to CEX-associated deposit infrastructure;
- sales into rising retail volume.
The follow-through often distinguishes patient positioning from short-lived inventory management.
Measure accumulation quality, not only accumulated size
Two clusters can acquire the same number of tokens while creating very different evidence. Score the covered activity on four dimensions:
- Acquisition coverage: what share of the increase is explained by verified swaps rather than transfers or unresolved inflows?
- Actor independence: how much remains after likely related wallets and internal transfers are collapsed?
- Retention quality: how much verified exposure remains after sales, protocol deposits, and unresolved outflows?
- Exit capacity: what share of the remaining position can be quoted for sale within the analyst's price-impact limit?
Do not combine these into a false-precision score. Keep the four answers visible. Strong acquisition coverage cannot repair shallow exit liquidity, and deep liquidity cannot prove that several addresses represent independent buyers.
Representative comparison
Cluster A records 70% of its balance increase through verified swaps, retains most covered exposure, and has no unexplained distribution. However, its first practical exit slice moves the quote sharply.
Cluster B records a smaller balance increase, but nearly all of it comes from swaps across independent blocks. The position is modest relative to executable depth and no related address is selling.
Cluster A accumulated more tokens. Cluster B presents cleaner, more executable accumulation evidence. Neither pattern predicts price direction.
Representative example: one apparent whale, four addresses
The following is a representative example, not a claim about a specific live wallet or token.
Over 72 hours, address A receives 120 ETH from a bridge and swaps 80 ETH for 4.0 million TOKEN. It transfers 1.5 million TOKEN to address B.
Address B later supplies 1.0 million TOKEN and paired WETH to a liquidity pool. Address C, funded by A, buys another 600,000 TOKEN.
Address D receives 900,000 TOKEN from an unrelated holder but sends no observable payment.
A naive address-level screen could report 7.0 million tokens of “whale inflows” across A through D. A reconciled reading is different:
- A and C show 4.6 million tokens of observable swap purchases.
- A-to-B transfers are internal to the likely cluster and must not be double-counted.
- B's LP deposit changes custody and risk, but does not erase cluster exposure in the same way as a sale.
- D's transfer is unclassified and should not be counted as a purchase without evidence of consideration.
- The 120 ETH bridge receipt is funding, not token accumulation.
The constructive signal is 4.6 million tokens of observed buying, adjusted for any later sales and the cluster's LP exposure. The uncertain D inflow belongs in a separate bucket.
Constructive accumulation patterns
A more credible accumulation pattern usually combines several of these signals:
- Net exposure rises through identifiable swaps across multiple blocks.
- Purchases use meaningful ETH or stablecoin consideration.
- The cluster retains most of the acquired exposure after internal transfers.
- Buying occurs across more than one venue or route without obvious self-trading.
- Position size is reasonable relative to executable liquidity.
- Funding arrives before purchases rather than tokens simply arriving from another holder.
- Later activity shows holding, staking, or measured liquidity provision rather than immediate distribution.
None of these proves future price performance. Together, they make the accumulation interpretation more defensible.
Risky patterns and distribution disguised as accumulation
Apparent accumulation becomes less trustworthy when you see:
- One old holder splitting tokens among many fresh wallets.
- Large inbound transfers with no corresponding payment.
- Cluster wallets buying small amounts publicly while a related wallet sells larger amounts elsewhere.
- LP removal counted as buying, followed by sales into the same pool.
- Tokens routed through contracts and returned to new addresses to create activity.
- Repeated buys in a pool with negligible executable depth.
- A whale's percentage ownership rising only because supply moved into inaccessible, burned, or contract-held addresses.
- Consolidation before a CEX deposit, bridge exit, or large router approval.
A common distribution pattern is visible buying plus hidden net selling. One wallet acquires tokens in obvious DEX swaps while another wallet in the same cluster transfers or sells a larger inventory.
Track the cluster's aggregate token and quote-asset flows before calling the behavior bullish.
False positives to avoid
Treating every token inflow as a buy
ERC-20 transfer logs describe movement, not motive. Airdrops, vesting claims, OTC settlements, bridge releases, and internal transfers can all increase a balance.
Counting both sides of an internal transfer
If two addresses belong to one operator, a transfer changes address-level balances but not cluster exposure.
Reading a contract deposit as a sale
A token leaving a wallet for a vault, staking contract, or LP position may remain economically owned by the depositor.
Reading an LP withdrawal as a buy
Tokens returning from a pool can create a sharp positive balance delta without new capital entering the asset.
Assuming shared CEX or bridge funding proves common control
Popular funding services serve many users. Treat source overlap as one clue, not a definitive label.
Trusting quoted value in a thin pool
The final trade price may mark the whole balance at a value that cannot be realized. Always test executable liquidity and slippage.
Ignoring liabilities and hedges
A wallet can hold spot tokens while borrowing against them, shorting elsewhere, or offsetting exposure on another chain or venue. Public on-chain data may reveal only part of the position.
A compact analyst checklist
Before labeling a Robinhood Chain wallet as an accumulating whale, confirm that you can answer:
- Which token contract and time window are being measured?
- What were the opening and ending balances?
- Which inflows were swaps, transfers, bridge receipts, LP withdrawals, or claims?
- Which outflows were sales, internal transfers, deposits, or liquidity additions?
- Are multiple addresses likely controlled by one entity?
- What did the cluster pay for the acquired tokens?
- How much exposure remains after all related activity?
- Can the position be sold through real available liquidity?
- Is another linked wallet distributing at the same time?
- What evidence would invalidate the accumulation thesis?
Use Robinhood Chain wallet tracking to repeat the process at consistent intervals rather than relying on a one-time snapshot.
Move from leaderboard discovery to transaction proof
Start with the native whale leaderboard, open the wallet row, and use Blockscout to classify each inflow and outflow by economic purpose before calling it accumulation.
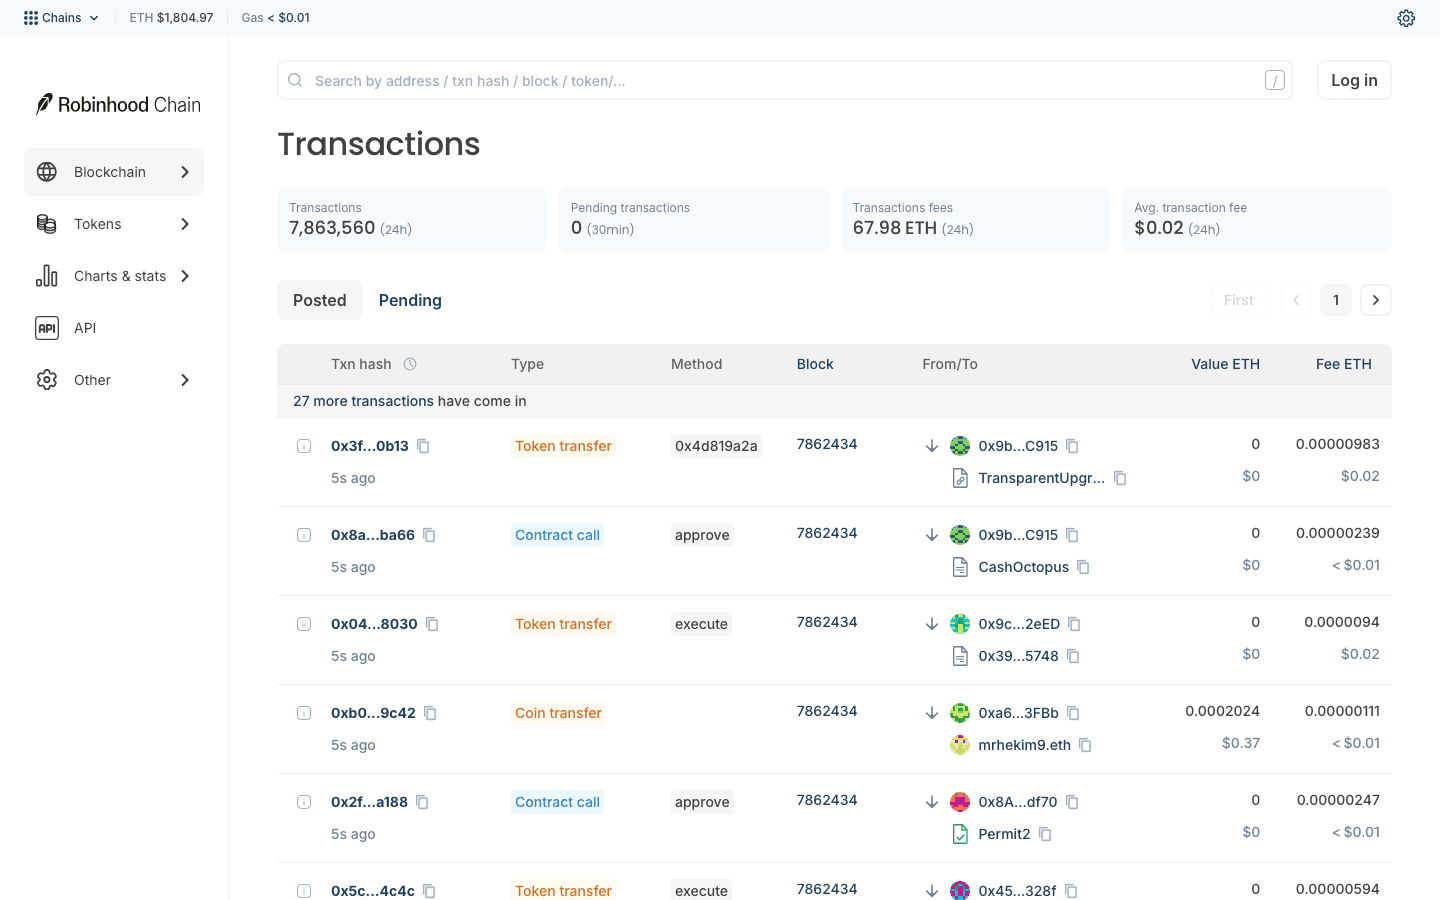
Transfers, approvals, swaps, bridge receipts, and contract calls can produce similar balance changes but different economic exposure.
- Validate the address with wallet tracking.
- Decide whether it is a whale or contract.
- Cluster related fresh addresses.
- Compare repeat behavior with the best-wallet framework.
- Estimate exposure with the wallet PnL method.
- Check the token with the memecoin framework.
Consult Ethereum transaction documentation before treating transfers as buys or sells.
FAQ
What counts as a whale on Robinhood Chain?
There is no universal balance threshold. A whale is an address or related wallet cluster whose position or trading activity is large relative to a token's supply, liquidity, or normal transaction size.
The relevant threshold changes by asset.
Does a rising wallet balance prove a whale is buying?
No. The increase may come from a transfer, bridge withdrawal, LP removal, claim, vesting release, or contract interaction. Confirm consideration paid and classify the transaction before calling it a purchase.
Should LP deposits count as accumulation?
Not as ordinary spot buying. LP activity changes the form and risk of exposure.
Track the wallet's underlying share of pooled assets separately, then include it in cluster-level economic exposure where the data supports that calculation.
Can fresh wallets hide one whale's activity?
Yes. One operator can fund several addresses, split buys among them, and later consolidate.
Shared funding, synchronized timing, repeated internal transfers, and common execution patterns can support a cluster hypothesis, but no single clue proves ownership.
Why does executable liquidity matter?
A token balance can have a high quoted value while available pools are too shallow to support a large exit. Executable liquidity tells you whether the marked position is economically meaningful at realistic slippage.
Is bridge funding a bullish signal?
It can show that capital arrived on Robinhood Chain, but it does not show what the user will buy. Treat bridge or CEX funding as a precursor to monitor, then wait for the actual asset flows.
How can distribution look like accumulation?
A cluster may execute visible buys from one address while transferring or selling a larger pre-existing position from another.
It may also split inventory among fresh wallets, making holder counts and address-level inflows rise while aggregate exposure falls.