Quick answer
To analyze Robinhood Chain memecoins, start with the Stalkchain leaderboard's volume, net flow, buyer, age, market-cap, holder-coverage, and liquidity fields.
Then verify the token contract, holder concentration, liquidity, and large or early wallets with public transactions. Missing fields are unknown, and several improving metrics still do not make a token safe.
The strongest setups show several independent signals improving together. Even then, memecoins remain extremely volatile, and apparently bullish on-chain activity can be manipulated or misread.
What makes Robinhood Chain different?
Robinhood describes Robinhood Chain as an Arbitrum Layer 2 built on Ethereum. Its official connection documentation says the network uses blobs for data availability and ETH for gas.
That means the basic research workflow should feel familiar to anyone who has analyzed other EVM chains:
- Wallets use standard Ethereum-style addresses.
- Tokens are identified by contract addresses.
- Transfers, swaps, approvals, and liquidity events are visible on-chain.
- ETH is required to pay transaction fees.
- Users can connect an EVM-compatible wallet, bridge assets, and trade through supported applications.
The potential audience is notable. Robinhood’s investor relations materials reported 27.7 million funded customers and $377 billion in platform assets as of May 31, 2026.
Those figures do not guarantee activity for any particular token, but they help explain why traders are watching the chain’s early markets.
A large potential distribution channel is not the same as healthy token demand. Every memecoin still needs to be assessed contract by contract and wallet by wallet.
Start with the live Robinhood memecoin leaderboard
Open the Robinhood Chain Memecoin Leaderboard before building a transaction-level case. It helps compare tokens on one screen using volume, net flow, buys and sells, unique buyers, fresh-buyer share, holder coverage, market cap, age, and liquidity edge.
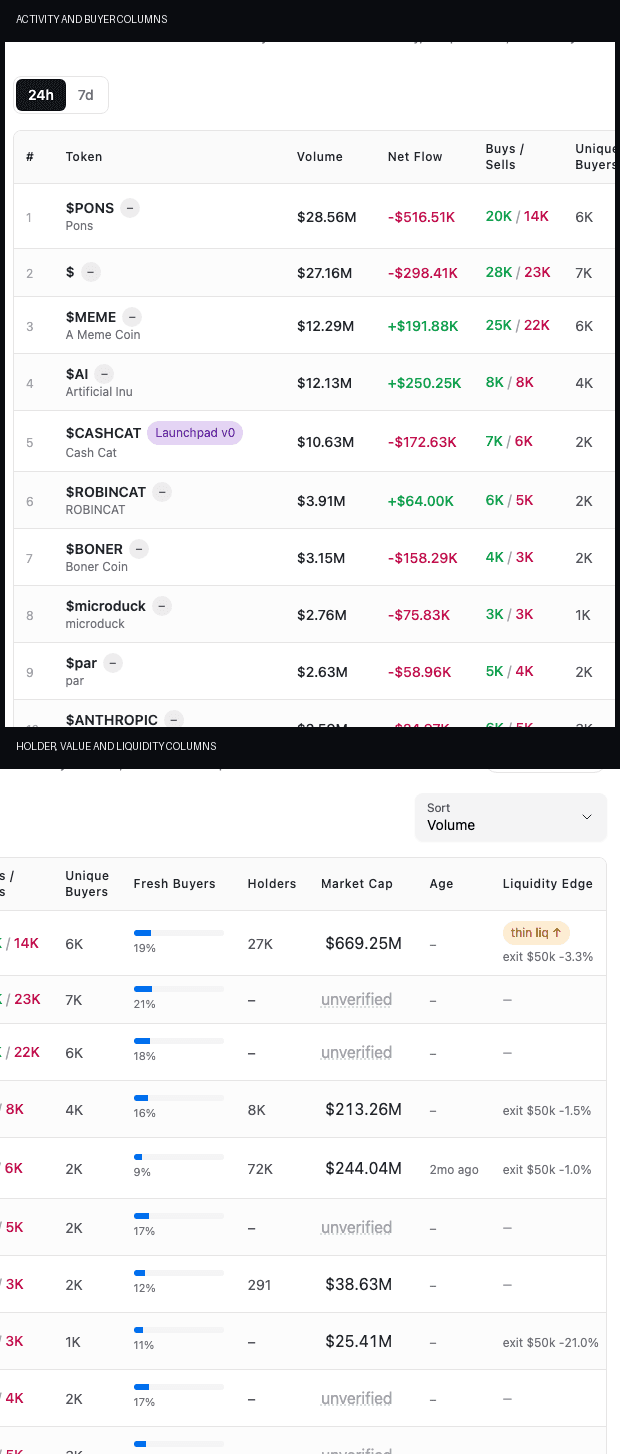
Focused, stacked reading crops from one live public-route capture on September 5, 2026. Read missing holder, age, valuation, or liquidity fields as unknown. They are not zeroes and do not reduce risk by themselves.
Use the screen to create a shortlist, not to choose a trade. A high net-flow row can still have concentrated holders or thin exit liquidity. A high fresh-buyer share can reflect genuine discovery, coordinated wallets, or automated distribution.
The next sections explain how to test each displayed signal.
Live example: three rows, three different research problems
The public 24-hour table returned 50 rows at approximately 00:33 UTC on September 5, 2026. The snapshot shows why volume, direction, breadth, and exit depth must be separated.
PONS
- 24h volume: $28.56M
- Net flow: -$516.51K
- Unique buyers: about 6,000
- Fresh buyers: 19%
- Liquidity readout: a $50K exit estimate showed -3.3%
- First question: does high turnover mask persistent distribution?
Artificial Inu
- 24h volume: $12.13M
- Net flow: +$250.25K
- Unique buyers: about 4,000
- Fresh buyers: 16%
- Liquidity readout: a $50K exit estimate showed -1.5%
- First question: does broad participation remain constructive after wallets and holders are de-duplicated?
STONKBROKER
- 24h volume: $1.25M
- Net flow: -$185.69K
- Unique buyers: about 1,000
- Fresh buyers: 14%
- Liquidity readout: a $50K exit estimate showed -50.9%
- First question: does severe displayed exit impact end the analysis before the token narrative matters?
This is a time-stamped discovery snapshot, not a recommendation. The values can change after capture. Contract addresses, pool reserves, holder relationships, and a fresh sell quote still need transaction-level verification.
Separate discovery from due diligence
The Robinhood Chain memecoin screener guide now owns the token-discovery workflow. Use that page when you need to understand the leaderboard fields, shortlist construction, and common screener false positives.
Use this analysis guide after a token reaches the shortlist. Its job is deeper due diligence: establish a baseline, inspect holder relationships, test liquidity, trace important wallets, and decide which observation would invalidate the thesis.
This separation matters because a screener compares tokens using available fields, while due diligence investigates evidence that may not fit in one row. A token can rank well and still fail the contract, concentration, or sell-path checks below.
Build an evidence ledger, not a single token score
Memecoin research becomes unreliable when observations from different times are blended into one verdict. Record each claim with its source, timestamp, contract address, and the event that would make it stale.
| Claim | Minimum evidence | Refresh when |
|---|---|---|
| Demand is broad | Buy count, unique buyers, wallet funding, and repeated-window activity | The leaderboard window changes or one cluster explains the growth |
| Ownership is distributed | Time-stamped holder table plus infrastructure labels and wallet links | A large transfer, mint, burn, bridge movement, or liquidity change occurs |
| Exit depth is usable | Exact-size sell quote, route, minimum output, and pool state | Price, reserves, active liquidity, or proposed size changes |
| A wallet still has exposure | Current token balance plus transfers and swaps since entry | The wallet sends, sells, bridges, or receives more tokens |
| A contract behavior is understood | Verified source where available, roles, upgradeability, approvals, and observed transfers | An implementation, admin, fee, or permission changes |
Classify every important claim as current, historical, or unresolved. Historical evidence can explain what happened, but it cannot prove current liquidity, holder control, or wallet exposure.
Use hard vetoes before positive scoring
Some findings should stop the analysis rather than merely reduce a score:
- The contract address cannot be matched across primary source, venue, and explorer.
- A representative sell quote is unavailable or exceeds the predefined impact limit.
- Holder or liquidity evidence is missing where it controls the thesis.
- One related wallet cluster explains most measured demand or supply.
- The approval spender, route, or minimum output cannot be verified.
Only compare positive signals after these vetoes pass. This prevents large volume or positive net flow from compensating for an unverifiable contract or unusable exit.
The memecoin screener consistency check helps identify the first mismatch. The research-first trading workflow explains how to carry the surviving evidence into a quote and receipt check without treating Stalkchain as an execution venue.
Before you start: prepare the wallet and verify the token
If you intend to interact with the network, begin with Robinhood’s official connection instructions rather than network details copied from social media.
The security-focused walkthrough is in how to add Robinhood Chain and bridge ETH safely.
The general process is:
- Add Robinhood Chain to an EVM-compatible wallet using the official network configuration.
- Bridge ETH through a supported route.
- Keep enough ETH aside for gas.
- Connect only to applications you have independently verified.
- Confirm the token’s contract address before swapping.
The contract address matters more than the ticker. Memecoin names and symbols are easy to duplicate, particularly when attention is moving quickly.
Obtain the address from an official project channel, then cross-check it against the trading venue and block explorer.
Use a separate trading wallet with limited funds when exploring new protocols. Avoid granting unlimited token approvals unless necessary, and revoke approvals you no longer use.
Step 1: Establish a baseline before interpreting growth
A number without a baseline is usually noise. Record the token’s current state before deciding whether its activity is unusual.
At minimum, capture:
- Token age
- Current holder count
- Unique wallets added during the last hour, day, and week
- Transfer and swap count
- Trading volume
- Available liquidity
- Largest holder balances
- Deployer and liquidity-provider addresses
- Recent price and valuation changes
The purpose is not to build a perfect spreadsheet. It is to create a time series.
For example, “3,000 holders” tells you very little on its own. Three thousand holders accumulated steadily over two weeks is different from 3,000 addresses appearing within ten minutes.
The second pattern could represent genuine discovery, an airdrop, dust transfers, Sybil wallets, or automated distribution.
Compare changes over consistent intervals. That makes acceleration visible and prevents a large cumulative number from disguising weak current activity.
Step 2: Measure wallet growth before price becomes the story
The source tutorial uses Cash Cat as a case study and highlights an important analytical pattern: a spike in wallet growth may appear before broader price attention.
That is worth monitoring, but not blindly trading.
Start with net wallet growth, not the raw number of transfers. You want to know whether the token is reaching new economic participants rather than bouncing among existing addresses.
Ask:
- How many first-time holders appeared?
- Did they receive meaningful balances or only dust?
- Did the increase happen gradually or in one synchronized burst?
- Are new wallets buying through swaps, or receiving direct transfers?
- Does wallet growth continue after the first spike?
- Is liquidity expanding alongside the holder base?
A healthier pattern is sustained growth across multiple intervals, with wallets entering through observable market purchases and no single source funding most of them.
A riskier pattern is hundreds of fresh wallets created or funded together, receiving similar token amounts from the same address cluster. That can make holder growth look organic when control remains concentrated.
Analyst rule: Treat wallet growth as an alert to investigate, not as a buy signal.
Step 3: Inspect holder distribution and concentration
Holder count measures breadth. Holder distribution measures control.
Rank the largest token accounts, then label addresses where possible. Some apparent whales may be contracts rather than individual traders:
- Liquidity pools
- Bridges
- Burn or dead addresses
- Treasury wallets
- Vesting contracts
- Exchange or router contracts
After excluding known infrastructure, calculate how much circulating supply is controlled by the largest economic holders.
Focus on:
- Top holder share
- Combined share of the top 5, 10, and 20 holders
- Deployer-linked balances
- Wallets funded by the same source
- Similar transaction timing
- Repeated transfers among top holders
- Large balances split across several fresh addresses
A token can appear decentralized because no address holds more than 3%, while ten connected wallets collectively control a dominant share. Address labels are useful, but transaction relationships are often more revealing.
Calculate raw and economic concentration separately
Keep two versions of the holder ranking. The raw view preserves every address exactly as the explorer reports it. The economic view separates pools, routers, bridge adapters, burn addresses, and other known infrastructure before ranking private holders.
Do not remove every contract automatically. A liquidity pool affects exit depth, while a treasury, vesting contract, or token adapter can still affect supply and control. Record the role and the reason for each exclusion.
Compare the top 1, 5, 10, and 20 shares under both views. Then trace the largest remaining wallets for shared funding, direct transfers, synchronized activity, and common consolidation addresses.
The dedicated Robinhood Chain holder-distribution guide shows this calculation with a time-stamped Blockscout example. Its central warning is simple: holder count measures addresses, not independent economic owners.
This is where the Robinhood KOL Screener, KOL tracker guide, and wallet-tracking workflow become useful: identify relevant addresses first, then study their funding history, counterparties, and recurring behavior rather than judging each wallet in isolation.
Step 4: Compare liquidity with market valuation
Market capitalization can look impressive while available exit liquidity remains small.
Review:
- Total pool liquidity
- Liquidity on the dominant trading pair
- Buy and sell slippage at realistic position sizes
- Whether liquidity is locked, burned, or controlled by a removable position
- Recent liquidity additions and withdrawals
- Volume relative to liquidity
- Pool concentration across trading venues
Suppose a token shows a high displayed valuation but only a thin pool supports trading. A modest sell can then move the price sharply.
The quoted market cap may describe the last traded price multiplied by supply, not the amount of capital that holders can actually withdraw.
Run small-size simulations before entering. Estimate slippage for both the purchase and the exit.
If your position cannot be sold without materially moving the market, liquidity, not the chart, is the binding constraint.
Watch liquidity-provider wallets as closely as token whales. A sudden liquidity removal can matter more than routine holder sales.
Apply the EXIT test before comparing narratives
Use five checks in order:
- Exit size: write down the token amount you may need to sell.
- Executable quote: request a current sell quote for that exact amount.
- Impact and output floor: separate price impact from slippage tolerance, then record minimum received.
- Trading pool: verify the pool contract, pair assets, active liquidity, and recent changes.
- Control: identify who can remove or reposition most usable depth.
Repeat the quote at a small validation size, half the proposed position, and the full proposed position. This shows whether impact grows gradually or the route fails after a threshold.
The dedicated Robinhood Chain liquidity and exit-risk guide explains the framework, the September 5 live comparison, and the final receipt checks. Its main rule is that market cap and wallet value are not realizable value.
Step 5: Track large holders and early wallets
Large-wallet tracking becomes useful when you separate accumulation, distribution, and internal movement.
For a transaction-level process, use the dedicated guide to tracking Robinhood Chain whale wallets.
For each important wallet, record:
- First interaction with the token
- Average entry range
- Current token balance
- Percentage already sold
- Deposits into or withdrawals from liquidity pools
- Transfers to fresh wallets
- ETH funding source
- Previous activity in other launches
- Whether transactions lead or follow public attention
Do not label every profitable early buyer “smart money.” An early wallet may be the deployer, a market maker, a coordinated promoter, or an address with privileged access.
Look for repeatable behavior. A wallet that entered several unrelated tokens early, managed exits gradually, and retained meaningful exposure is more informative than an address that happened to profit once.
You can monitor changes through Stalkchain signals, but alerts still require interpretation. A whale transfer to another wallet is not automatically a sale.
Confirm whether the receiving address later interacts with a pool, exchange, bridge, or additional related wallets.
Step 6: Combine signals instead of relying on one metric
The most useful analysis comes from convergence.
More constructive pattern
- New wallets are growing across several time windows.
- Most additions come from actual swaps rather than token distributions.
- Ownership becomes less concentrated as participation expands.
- Liquidity grows with volume and valuation.
- Early wallets take partial profits without abandoning the token.
- No connected cluster controls an excessive share of supply.
- Large buys do not immediately precede coordinated promotion.
Higher-risk pattern
- Holder count jumps through dust transfers or identical fresh wallets.
- Top ownership is hidden across related addresses.
- Valuation rises much faster than liquidity.
- Deployer-linked wallets transfer supply toward trading venues.
- A few wallets produce most volume through repetitive transactions.
- Liquidity can be removed by one party.
- Early buyers distribute heavily into later attention.
No checklist eliminates risk. Its purpose is to reject weak setups faster and identify which assumptions still need verification.
Red flags that deserve immediate attention
Pause the analysis when you find any of the following:
- Unverified or duplicated contract addresses. The token may be an imitation.
- Unclear transfer or sell behavior. Test cautiously; contract restrictions can change practical exit conditions.
- Concentrated deployer-linked ownership. Supply may be split across superficially independent wallets.
- Shallow or removable liquidity. Displayed valuation may not survive ordinary selling.
- Synchronized fresh wallets. Holder growth may be manufactured.
- Circular volume. Repeated trading among related wallets can inflate activity.
- Large approvals to unknown contracts. The wallet risk may exceed the token opportunity.
- Claims based only on past returns. Unverified ROI or market-cap screenshots are not primary evidence.
A final pre-trade checklist
Before swapping a Robinhood Chain memecoin, confirm that you can answer:
- Is this the correct contract?
- How old is the token?
- Is wallet growth organic, sustained, and economically meaningful?
- Who controls the largest non-contract balances?
- Are major holders related through funding or transfers?
- How much usable liquidity supports the market?
- What slippage would apply to my planned exit?
- Can the liquidity provider withdraw the pool?
- What are early and large wallets doing now?
- Which observation would invalidate my thesis?
If several answers are unknown, the analysis is incomplete. Reducing position size does not fix an unverified contract or an impossible exit.
Assign an evidence state to every answer
Mark each checklist answer as verified current, verified historical, inferred, or unknown. Add the source, timestamp, contract address, and refresh trigger.
This matters because the checks expire at different speeds. A contract address is stable, but a sell quote can become stale in seconds. Holder concentration changes after transfers, while wallet exposure changes after any swap, bridge, or send.
The standalone Robinhood Chain token due diligence checklist turns these checks into a complete contract-to-receipt workflow. Use it when you need a compact decision record rather than a general analysis tutorial.
Separate the research decision from the wallet signature
A token passing due diligence does not make every quote or application safe. Before moving from analysis to execution, write down the exact contract, intended input, maximum acceptable price impact, slippage ceiling, minimum output, and ETH gas reserve.
Then compare the buy quote with a representative sell quote. Confirm that both routes identify the expected pool and that the sell remains plausible at the planned position size.
Review any token approval as a separate risk decision. The spender must belong to the intended application, and the allowance should not be broader than necessary without a clear reason.
After a small first trade, verify the transaction status, transfers, gas, and received balance in Blockscout. A wallet notification saying the transaction was submitted is not settlement proof.
The Robinhood Chain memecoin trading guide turns this research result into a quote, approval, swap, receipt, and exit-verification workflow. Stalkchain supports the discovery and analysis stages, not Robinhood Chain order execution.
Verify the shortlist with the contract and holders
After using the leaderboard, open the exact contract in the Robinhood Chain token directory to inspect holders, transfers, metadata, and verified source information.
- Verify the token contract on chain ID 4663 using the official network guide.
- Inspect the earliest and largest wallets with wallet tracking.
- Check whether early addresses are fresh-wallet signals or coordinated noise.
- Evaluate large holders with the whale-wallet guide and accumulation test.
- Rank repeat performers with the best-wallet criteria, then review their estimated PnL limitations.
- If the token survives the research process, follow the controlled trading checklist and verify the contract, pool, price impact, slippage, gas requirement, approval, and representative sell path before choosing an execution venue.
FAQ
Is wallet growth bullish for a Robinhood Chain memecoin?
It can be constructive when new wallets buy meaningful amounts over time and ownership becomes broader. It is less useful when wallets receive dust, are funded together, or appear in one automated burst.
Always compare wallet growth with liquidity, distribution, and transaction sources.
Can on-chain data predict a memecoin’s price?
No. On-chain data can reveal participation, concentration, liquidity, and wallet behavior, but it cannot guarantee future demand.
Social attention, market conditions, contract risk, and coordinated selling can overwhelm an otherwise positive signal.
What is the most important metric to check first?
Start by verifying the contract address. After that, examine liquidity and holder concentration before spending much time on price narratives.
A token with unsafe liquidity or concentrated control can invalidate other apparently positive metrics.
Why track early wallets?
Early wallets can reveal whether experienced participants, insiders, automated traders, or coordinated clusters captured the initial supply. Their later behavior also shows whether they retain exposure or distribute into new demand.
Does Robinhood Chain use ETH for gas?
Yes. Robinhood’s official connection documentation describes Robinhood Chain as an Arbitrum Layer 2 on Ethereum and states that ETH is used for transaction fees.
Is Cash Cat a confirmed model for future tokens?
No. Cash Cat is discussed as a case study in the source tutorial. Its observed sequence should be treated as an example of what to investigate, not a template that guarantees the same outcome in another token.
Sources and further viewing
- Robinhood Chain official connection documentation
- Robinhood Chain mainnet announcement
- Stalkchain Robinhood Chain Memecoin Leaderboard
- Stalkchain Robinhood Chain KOL Screener
- Robinhood Chain MemeCoins Full Tutorial & Deep Dive
Memecoins are extremely volatile. On-chain analysis can improve the questions you ask, but it cannot turn uncertain markets into certain outcomes.
Verify primary sources, protect wallet permissions, size positions around available liquidity, and assume every signal can produce false positives.