Quick answer
To analyze Robinhood Chain holder distribution, open the exact token contract, export or inspect the holder list, and label pools, routers, bridges, burn addresses, treasuries, and other contracts before calculating concentration.
Then measure the top economic holders, trace shared funding and transfers, compare balances over time, and test those positions against usable liquidity. A large holder count is not proof of broad ownership, and one address is not always one independent owner.
What holder distribution means
Holder distribution describes how a token's supply is spread across addresses and, after investigation, economic owners.
It answers a different question from holder count. Holder count tells you how many addresses have a balance. Distribution asks how much control the largest holders have and whether apparently separate addresses may act together.
The distinction matters because an address can represent:
- One independent trader
- A liquidity pool serving many traders
- A bridge or cross-chain adapter
- A treasury or vesting contract
- A burn address
- A smart account
- One wallet inside a larger related cluster
A raw holder table mixes these categories. The first job is classification, not arithmetic.
Why holder distribution matters
Concentrated ownership can increase several risks:
- A small group may control a large share of circulating supply.
- One exit can overwhelm available pool liquidity.
- Related wallets can create the appearance of broad demand.
- Deployer-linked balances can move toward pools without warning.
- Governance or community claims may not match economic control.
Low concentration does not make a token safe. A widely distributed token can still have unsafe contracts, removable liquidity, circular volume, or weak demand.
Use holder distribution as one layer in a broader Robinhood Chain memecoin analysis workflow.
Start with Stalkchain holder coverage
The public Robinhood Chain memecoin screener shows a holder field when coverage is available. It places holder coverage beside volume, net flow, buys and sells, unique buyers, fresh-buyer share, market cap, age, and liquidity edge.
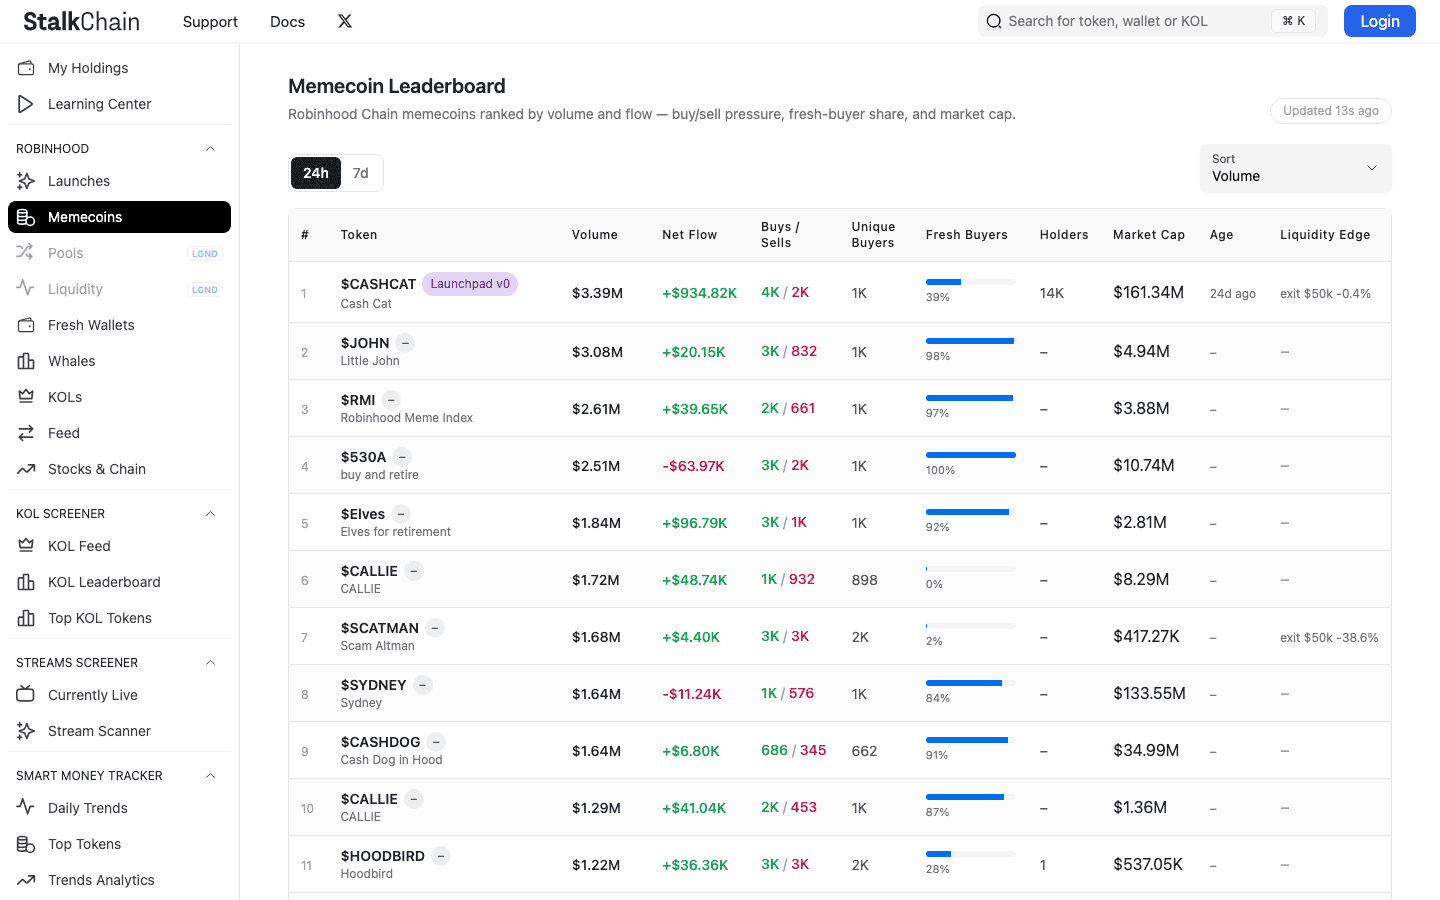
Holder coverage helps identify which tokens support a deeper distribution review. A blank value is unknown, not zero.
Use the screener to find a contract worth investigating. Do not treat the displayed holder count as a concentration score.
The dedicated screener guide explains how to combine coverage with current activity before moving to the holder-level workflow below.
Step 1: verify the exact token contract
Names and tickers are easy to duplicate. Holder analysis must begin from the contract address, not a search result that merely uses the same symbol.
Confirm:
- Robinhood Chain mainnet is selected with chain ID 4663.
- The contract matches an official project source and the trading venue.
- The token page reports the expected symbol, decimals, and total supply.
- The contract is verified when source verification is available.
- Transfers and active pools resolve to the same contract.
The Robinhood Chain network and bridge guide explains how to verify the network before interacting with a token.
Step 2: label contracts before calculating concentration
Open the holder list in Robinhood Chain Blockscout. For each large balance, record the address, quantity, percentage, contract status, public label, and any verified contract name.
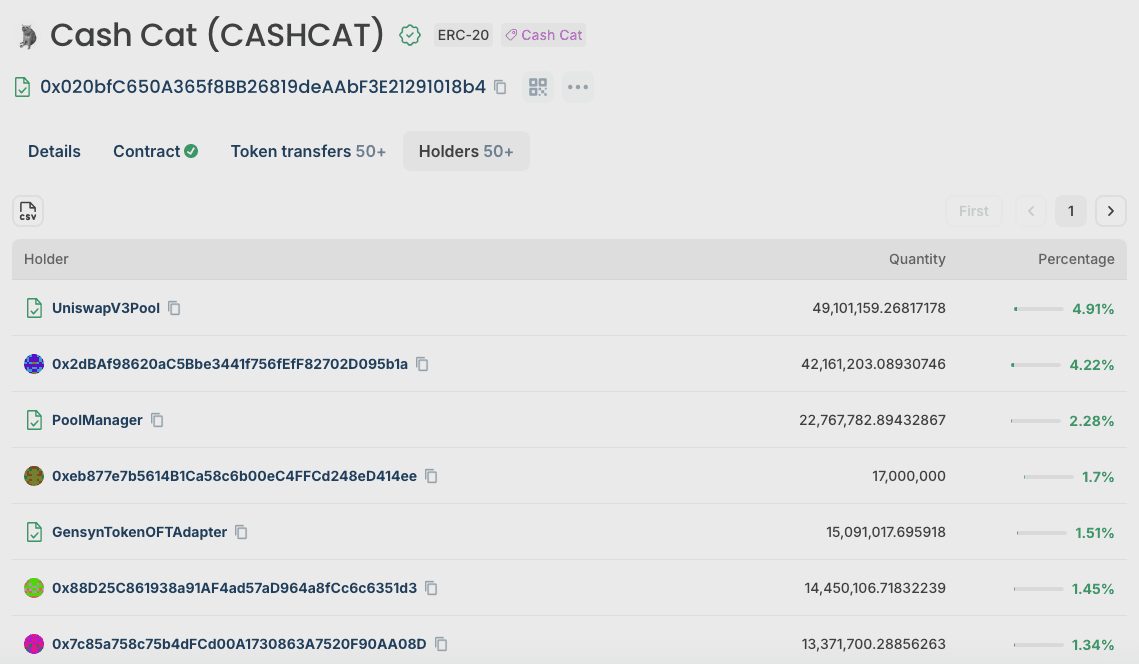
Cash Cat holder table captured from Robinhood Chain Blockscout on July 28, 2026. Balances and rankings change. The image is evidence of the reading method, not a recommendation.
Separate likely infrastructure from economic holders:
- Pools: balances support trading and should not be labeled as one private whale.
- Routers and pool managers: contracts may temporarily custody or route assets.
- Bridges and adapters: balances may represent users or supply on another chain.
- Burn addresses: tokens may be permanently or intentionally removed from circulation.
- Treasuries and vesting contracts: balances can be economically controlled but may have restrictions.
- Unlabeled contracts: inspect code, events, and counterparties before classifying them.
Step 3: calculate more than one concentration view
There is no universal safe top-10 percentage. Calculate several views because each answers a different question.
Raw address concentration
Add the percentages held by the largest addresses exactly as the explorer reports them.
This is reproducible, but it mixes pools, contracts, burn addresses, and private wallets.
Economic-holder concentration
Remove known infrastructure from the ranking, then add the largest remaining holders.
This is more useful for sell-pressure analysis, but only as good as the labels and cluster work behind it.
Circulating concentration
Adjust the denominator when a defensible circulating supply differs from total supply. Document every excluded balance.
Do not quietly remove deployer, treasury, or vesting balances simply because they are not trading today. Restricted supply can still become relevant later.
Example: reading the Cash Cat holder table
This is a time-stamped research example, not a current trade thesis. On July 28, 2026, the Robinhood Chain Blockscout API reported:
- Total supply of 1 billion CASHCAT.
- 33,881 holder addresses.
- The largest address, a labeled Uniswap V3 pool, held about 4.91%.
- The second address, an unlabeled externally owned account, held about 4.22%.
- A labeled PoolManager held about 2.28%.
- A labeled token adapter held about 1.51%.
- The raw top 10 addresses held about 21.02% combined.
- The top 10 externally owned accounts visible in the ordered holder data held about 15.30% combined.
The raw top-10 number is not a final decentralization verdict. Three of the first five addresses were labeled contracts with different economic roles.
The unlabeled wallets also cannot be assumed independent. The next check is whether they share funding, transfer directly, activate together, or consolidate into common destinations.
This example shows why a token with tens of thousands of holder addresses can still require careful concentration analysis.
Step 4: trace the top economic holders
For each important non-infrastructure address, review:
- First funding transaction
- First token receipt or purchase
- Current balance and historical balance changes
- Direct transfers from the deployer or treasury
- Swaps versus ordinary transfers
- Common counterparties
- Shared funding with other holders
- Consolidation into one wallet, bridge, or exchange
- Current exposure versus tokens already distributed
The Robinhood Chain wallet-tracking guide provides the transaction-level process. Use the whale-wallet workflow when one holder could materially affect the market.
Treat ownership links as confidence-weighted hypotheses. Two users touching the same popular router is weak evidence. Shared private funding plus repeated coordinated transfers is much stronger.
Step 5: compare snapshots, not only the current ranking
One holder table is a state, not a direction.
Save comparable snapshots and measure:
- Top 1, 5, 10, and 20 economic-holder shares
- New entries into the top-holder group
- Balance changes for deployer-linked wallets
- Transfers from large wallets to fresh addresses
- Pool and treasury balance changes
- Whether concentration rises or falls as holder count grows
A declining top-10 share can be constructive when tokens move to independent buyers through real swaps.
It can be risky when one entity splits supply across new wallets. Apply the fresh-wallet funding and timing checks before calling the distribution organic.
Define what makes a holder snapshot stale
Record the block or timestamp behind each snapshot. Refresh it after a large transfer, mint, burn, bridge movement, treasury release, liquidity change, or unusual increase in holder count.
Keep the old snapshot as historical evidence instead of replacing it without a trace. Direction comes from comparing like-for-like observations with the same denominator and classification rules.
If a wallet changes role between snapshots, document the change. A private holder that supplies liquidity should not disappear from the ownership story merely because its tokens moved into a pool position.
The broader Robinhood Chain token due diligence checklist shows how holder evidence combines with contract privileges, buyer independence, executable liquidity, approvals, and receipts.
Step 6: test concentration against liquidity
A 2% holder does not have the same market impact in every token.
Compare each important balance with:
- Quote-asset liquidity in active pools
- Current buy and sell price impact
- Depth for a representative exit
- Daily volume that is not circular
- The holder's usual sale cadence
- Whether the holder also controls removable liquidity
A modest supply percentage can still dominate a thin market. Conversely, a larger percentage may be less immediately dangerous when it belongs to transparent infrastructure or a restricted treasury.
The Stalkchain whale tracker can identify trade-derived unsold balances. Its estimated positions still need a current price and a realistic exit quote.
Healthier and riskier patterns
More constructive pattern
- Large infrastructure addresses are identified and explained.
- No private wallet or connected cluster dominates economic supply.
- Concentration falls as independent buyers enter through swaps.
- Top holders use varied funding sources and transaction timing.
- Liquidity grows alongside circulating ownership.
- Large wallets retain or reduce exposure gradually relative to pool depth.
Higher-risk pattern
- Several large wallets share a private funder.
- Deployer-linked supply is split across fresh addresses.
- Holder count rises through dust transfers.
- One cluster controls tokens and removable liquidity.
- Large balances move toward pools while public attention rises.
- Market cap expands much faster than usable exit liquidity.
These patterns guide investigation. None predicts price by itself.
False positives to avoid
Counting pools as private whales
A pool can rank first because it holds inventory for traders. Identify the pool and evaluate its ownership and depth separately.
Treating every address as one owner
One entity can use many addresses, while a contract can represent many users. Address count and owner count are not interchangeable.
Removing every contract from the analysis
Treasuries, adapters, vesting systems, and unverified contracts may still affect economic control. Classify them instead of hiding them.
Using total supply without stating the denominator
Burned, locked, bridged, or non-circulating balances can change the interpretation. Show whether the percentage uses total, circulating, or liquid supply.
Assuming a lower top-10 share is always improving
Concentration can appear to fall when one holder distributes to related wallets. Trace the recipients and their later behavior.
Reading holder count as demand
Dust transfers and automated distribution can create many holders without meaningful purchases. Compare holder growth with unique buyers and net inventory changes.
Use Stalkchain as the research loop
Start with the Robinhood Chain memecoin screener to identify tokens with visible holder coverage and relevant activity.
Then:
- Verify the contract in Blockscout.
- Label the largest addresses.
- Calculate raw and economic concentration.
- Trace top wallets and related clusters.
- Compare concentration across snapshots.
- Check whale behavior, current flow, and usable liquidity.
- Define the evidence that would invalidate the thesis.
Stalkchain provides the discovery and wallet-research surfaces. Blockscout supplies public contract and holder evidence. Neither turns concentration into a guaranteed trading signal.
Final checklist
- Confirm the exact contract and chain ID 4663.
- Record total supply and the concentration denominator.
- Label pools, routers, bridges, adapters, burn addresses, and treasuries.
- Calculate top 1, 5, 10, and 20 address shares.
- Recalculate for economic holders after documented exclusions.
- Trace top-wallet funding, transfers, and current exposure.
- Test whether apparently separate wallets are related.
- Compare snapshots to distinguish accumulation from distribution.
- Measure large balances against real pool depth and sell impact.
- Treat missing coverage and unknown labels as uncertainty.
FAQ
What is a good holder distribution on Robinhood Chain?
There is no universal percentage. Compare the largest economic holders with similar tokens, circulating supply, pool depth, token age, and wallet relationships. A low raw top-10 share can still hide one connected cluster.
How do I see the holders of a Robinhood Chain token?
Open the exact token contract in Robinhood Chain Blockscout and select the Holders tab. Verify the contract first because duplicated names and tickers can lead to the wrong holder list.
Does a high holder count mean a token is decentralized?
No. Holder count measures addresses with balances. Dust transfers, contracts, and one entity using many wallets can inflate the count without broad economic ownership.
Should liquidity pools be excluded from top-holder concentration?
Separate them from private economic holders, but do not ignore them. Pool balances affect liquidity and exit capacity. State clearly whether your concentration view includes or excludes pools.
Can Stalkchain identify every connected wallet?
No analytics surface can prove every ownership relationship. Use funding, transfers, timing, repeated behavior, and consolidation as evidence, then state the confidence level rather than claiming certainty.
Can holder distribution predict a token's price?
No. It can reveal concentration, control, and potential sell pressure. Demand, liquidity, contract behavior, market conditions, and wallet actions can still dominate price.