Quick answer
A Robinhood Chain memecoin screener helps you compare tokens by current activity before opening every contract individually.
Stalkchain's public screener shows volume, net flow, buy and sell counts, unique buyers, fresh-buyer share, holder coverage, market cap, age, and liquidity edge.
Use it to build a shortlist, not to select a trade. Verify the contract, holder concentration, wallet relationships, pool liquidity, price impact, and a realistic sell path before acting.
What the Robinhood Chain memecoin screener shows
The Stalkchain Robinhood Chain Memecoin Screener organizes token activity into one comparison surface. The visible fields answer four different research questions:
- Demand: volume, buys, sells, unique buyers, and net flow.
- Buyer quality: fresh-buyer share and repeat participation.
- Token context: age, market cap, and holder coverage.
- Exit conditions: liquidity edge and the relationship between activity and available liquidity.
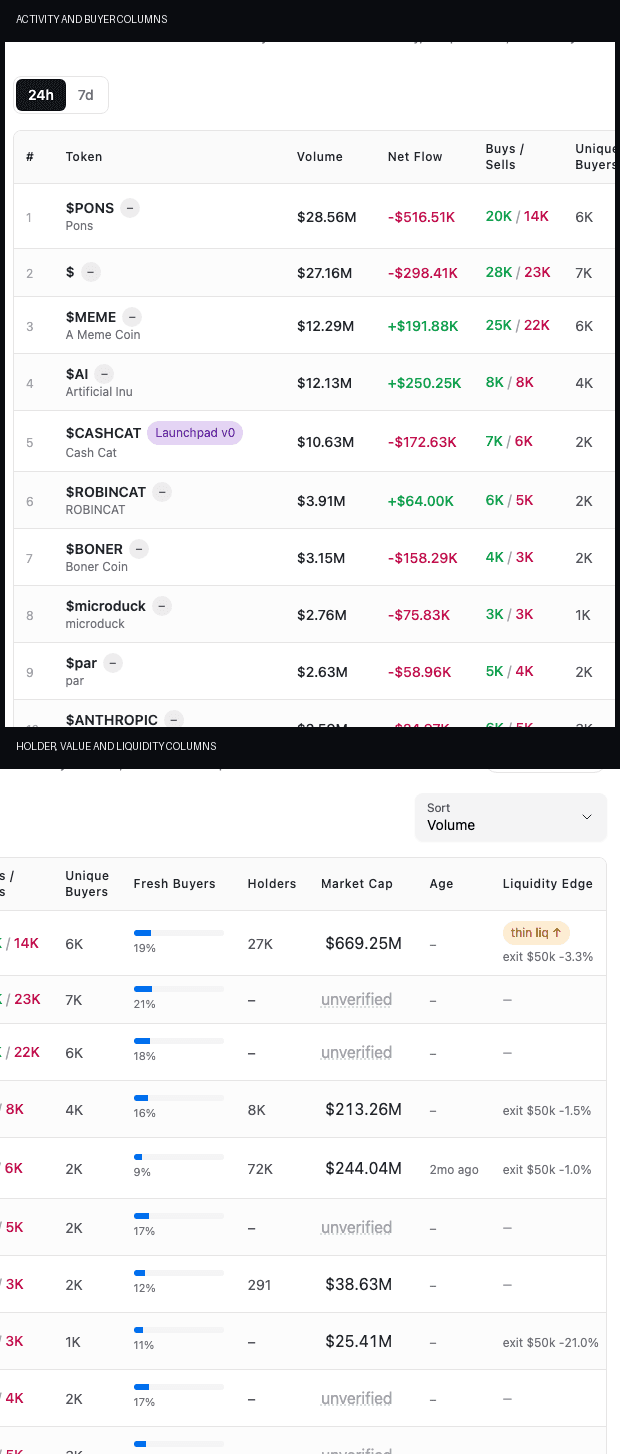
Focused, stacked reading crops from one live public-route capture on September 5, 2026. The screener is a discovery layer. A blank field is unknown, not zero, and a strong row still needs transaction-level verification.
Use a three-stage research workflow
A useful screener workflow separates discovery, verification, and execution checks.
- Discovery: compare tokens on consistent activity and risk fields.
- Verification: inspect the contract, holders, pools, and important wallets.
- Execution checks: obtain a current quote, estimate price impact, reserve ETH for gas, and test the sell path independently.
This separation prevents an attractive leaderboard row from bypassing the checks that determine whether the token and market are real.
Add a consistency check before opening a token
A useful row should make sense across activity, breadth, valuation, and exit depth. When the fields disagree, the disagreement is the research lead.
Use this four-part check:
- Activity consistency: compare volume with buy and sell counts. Large volume from few transactions may depend on a small number of wallets.
- Breadth consistency: compare unique buyers with total buys and fresh-buyer share. Many buys do not prove many independent participants.
- Valuation consistency: compare market cap with holder coverage and token age. A precise valuation beside missing holder or age data should not receive extra confidence.
- Exit consistency: compare volume and market cap with the displayed exit estimate. Turnover and valuation can look strong while sell depth remains poor.
Live example: similar activity, different evidence quality
On September 16, 2026, the public 24-hour leaderboard returned 50 rows and approximately $87.88 million in total displayed volume. The following rows illustrate why field consistency matters. Values are a time-stamped snapshot, not recommendations.
- PONS: $13.09M volume, +$582.57K net flow, about 6,000 unique buyers, 13% fresh buyers, 27,000 holders, $568.08M displayed market cap, and a displayed $50K exit estimate of -2.3%.
- CHINAPAD contract: $9.34M volume, -$170.76K net flow, about 3,000 unique buyers, 94% fresh buyers, no displayed holder coverage, $119.07 displayed market cap, and no displayed exit estimate.
- NVIDIA NeMo: $1.43M volume, +$117.11K net flow, 608 unique buyers, 100% fresh buyers, no displayed holder coverage, $17.75M displayed market cap, and no displayed exit estimate.
PONS had the most internally complete row of the three, but still required contract, holder, and live quote checks. CHINAPAD and NVIDIA NeMo showed unusually high fresh-buyer shares beside missing holder and exit fields. That combination raises questions about wallet independence and sellability; it does not justify a bullish conclusion.
Always use the contract address, not the ticker, when a name appears more than once. The same September 16 table contained a second CHINAPAD contract with different activity and incomplete valuation data.
Step 1: Start with volume and net flow
Volume measures the total value traded during the selected period. Net flow asks whether measured buying exceeded selling or the reverse.
Read the two fields together:
- High volume with positive net flow: buyers currently exceed sellers in measured value, but demand may be concentrated in a few wallets.
- High volume with flat net flow: the market is active, but turnover may be balanced, routed repeatedly, or driven by short holding periods.
- Low volume with positive net flow: the direction looks constructive, but even a modest order may explain most of the result.
- Negative net flow: measured selling exceeds buying, although transfers and venue coverage still need review.
Net flow is not a prediction. It describes the measured window. A token can move from accumulation to distribution quickly, particularly when liquidity is thin.
Step 2: Compare buys, sells, and unique buyers
Transaction counts show how often activity occurred. Unique buyers estimate how broadly purchases were distributed.
A row with 500 buys and 12 unique buyers is different from one with 500 buys and 250 unique buyers. The first can reflect repeated routing, bots, or a small active group. The second shows broader participation, but not necessarily independent control.
Ask:
- How many buys came from each wallet?
- Did one address produce a large share of volume?
- Are the same wallets trading in both directions?
- Did buyer breadth persist across more than one interval?
- Are transfers being mistaken for economic participation?
Use the wallet-tracking workflow when a token's activity depends on a small set of addresses.
Step 3: Treat fresh-buyer share as a question
Fresh buyers can indicate new attention. They can also represent bots, coordinated funding, Sybil distribution, or wallets created to conceal common control.
A healthier pattern has fresh wallets funded from varied sources, buying at different times and sizes, with some continuing to hold. A riskier pattern has many new addresses funded by one source, acting within the same block range, and receiving or buying similar amounts.
Apply the dedicated fresh-wallet analysis framework before calling fresh participation organic.
Step 4: Check holder coverage before reading concentration
Holder coverage describes how much of the relevant holder picture the interface can support. It is not the same thing as healthy distribution.
Open the exact token contract in the Robinhood Chain token explorer, then separate economic holders from infrastructure such as pools, bridges, routers, treasuries, burn addresses, and vesting contracts.
After labeling known infrastructure, inspect:
- Largest economic holder share
- Combined share of the top 5, 10, and 20 holders
- Deployer-linked balances
- Direct transfers among large wallets
- Common funding sources
- Similar transaction timing and sizing
- Supply split across several fresh addresses
Ten wallets can appear independent while behaving as one cluster. The whale-wallet guide explains how to distinguish accumulation, transfers, liquidity operations, and distribution.
Holder count and holder concentration answer different questions
The Holders field shows the breadth of addresses covered by the current data. It does not show how much supply the largest economic owners control.
After opening the contract, calculate at least two concentration views:
- Raw address share: the top 1, 5, 10, and 20 addresses exactly as listed.
- Economic-holder share: the largest remaining holders after labeled pools, routers, bridge adapters, burn addresses, and other infrastructure are classified separately.
Document every exclusion. Pools still matter for exit depth, and treasuries or adapters may still affect supply. An unlabeled wallet should remain unknown until funding and transaction evidence supports a stronger classification.
Use the Robinhood Chain holder-distribution workflow to calculate both views, trace connected wallets, and compare concentration over time. A falling raw top-10 share is not automatically healthy if one entity is splitting tokens across fresh addresses.
Step 5: Put market cap and token age in context
Market cap is a valuation estimate based on supply and the current quoted price. It is not the amount of capital available for holders to withdraw.
Token age changes how other metrics should be interpreted. A new token can have little history, unstable liquidity, incomplete labels, and extreme buyer concentration. An older token provides more evidence, but age alone does not remove contract or liquidity risk.
Compare tokens with similar ages and liquidity conditions. A one-hour token should not be benchmarked against a market that has traded for weeks.
Step 6: Use liquidity edge as an investigation lead
Liquidity determines whether a displayed price can support your intended position. The screener's liquidity context helps identify rows that deserve pool-level review, but it cannot replace a live quote.
Verify:
- The dominant token pair and pool contract
- Current reserves or active liquidity
- Which party can remove or reposition liquidity
- Price impact for your intended buy
- Quoted output for a representative sell
- Transfer restrictions, taxes, or unusual token behavior
- Whether recent volume is large relative to pool depth
A token can show a large market cap and strong volume while offering very little usable exit liquidity. If your representative sale materially moves the market, the displayed valuation is not your realizable value.
Convert the liquidity edge into a verification queue
Sort the shortlist into three practical groups:
- Immediate veto review: the displayed exit estimate is severe, missing, or inconsistent with the token's volume and valuation.
- Pool verification: the estimate looks usable, but pool identity, active liquidity, quote asset, or provider control is still unknown.
- Quote-ready: the contract and pool match, recent liquidity is understood, and the intended sell size can be tested independently.
No group is a buy list. The queue only determines what evidence to collect next.
For every candidate, request sell quotes at a small validation size, half the proposed position, and the full proposed position. Record expected output, price impact, fees, slippage tolerance, and minimum received.
Use the Robinhood Chain liquidity and exit-risk workflow to verify the pool, trace liquidity control, and check any completed receipt. A clean leaderboard estimate remains temporary until the exact current route supports the amount you may need to sell.
Example: three live rows, three different conclusions
The public 24-hour table returned 50 rows at approximately 00:33 UTC on September 5, 2026. These values are a mutable research snapshot, not recommendations.
- PONS: $28.56M volume, -$516.51K net flow, about 6,000 unique buyers, 19% fresh buyers, 27,000 holders, and a displayed $50K exit estimate of -3.3%.
- Artificial Inu: $12.13M volume, +$250.25K net flow, about 4,000 unique buyers, 16% fresh buyers, 8,000 holders, and a displayed $50K exit estimate of -1.5%.
- STONKBROKER: $1.25M volume, -$185.69K net flow, about 1,000 unique buyers, 14% fresh buyers, 26,000 holders, and a displayed $50K exit estimate of -50.9%.
PONS led volume but showed net selling. Artificial Inu paired positive measured flow with the least severe displayed exit estimate of the three. STONKBROKER showed why holder count and volume cannot rescue weak depth: the representative exit estimate was dramatically worse.
The table supports a shortlist, not a trade conclusion. Confirm the contract, pool, holder relationships, current reserves, and a fresh size-specific quote because every displayed value can change after capture.
Healthier and riskier screener patterns
More constructive pattern
- Volume and buyer breadth grow across several windows.
- Positive net flow comes from multiple unrelated wallets.
- Fresh wallets have varied funding histories and entry times.
- Holder concentration declines as participation expands.
- Liquidity grows with activity and valuation.
- Large or early wallets retain exposure without dominating the float.
Higher-risk pattern
- One wallet or cluster explains most net buying.
- Buy counts rise without comparable unique-buyer growth.
- Fresh wallets are funded and activated together.
- Holder coverage is missing or concentration remains unclear.
- Valuation rises much faster than usable liquidity.
- Early wallets distribute into later attention.
Cross-check memecoin activity with KOL data
The Robinhood Chain KOL Tracker provides a separate attributed-wallet research surface. Use it after a token passes basic contract and liquidity checks.
Several KOL wallets buying the same token can show attention convergence. It can also increase crowding. Verify whether the wallets entered independently, whether they still hold, and whether later buyers would receive materially worse execution.
The top-trader methodology explains how to reconstruct completed trades. The wallet PnL guide explains why incomplete basis and partial unrealized coverage can distort a profitable-looking row.
False positives to avoid
Circular volume
Related wallets can trade repeatedly and inflate volume without creating broad demand. Compare counterparties, funding, timing, and net inventory changes.
Dust-based holder growth
A token can reach many addresses through tiny transfers. Count economically meaningful holders and identify the distributor.
One large buyer
A single purchase can create positive net flow and price movement. Separate concentration from broad participation.
Contract and infrastructure wallets
Pools, routers, bridges, treasuries, and burn addresses can appear among top holders. Label them before calculating economic concentration.
High displayed market cap
Market cap does not measure exit capacity. Test live liquidity and price impact at the position size you would actually use.
KOL convergence
Attributed wallets can react to the same public event or promotion. Several names on one token do not prove independent conviction.
Turn a shortlist into a controlled trade decision
The screener stops at discovery. If a token survives the contract, holder, and liquidity checks, move to an execution checklist rather than treating the row as an order ticket.
Before signing anything:
- Match the contract across the project source, explorer, and chosen swap application.
- Request current buy and representative sell quotes at the intended size.
- Review route, price impact, slippage tolerance, minimum received, gas, and venue fees.
- Confirm the approval spender and avoid unexplained unlimited allowances.
- Start with a small trade and verify the receipt and token balance in Blockscout.
- Recheck the sell route before increasing exposure.
The Robinhood Chain memecoin trading guide covers approvals, quotes, swap verification, and exit checks. Stalkchain does not currently execute Robinhood Chain orders, so venue selection and every wallet signature remain independent decisions.
Promote a row only when the evidence is complete enough
Before a shortlisted row advances, create one record containing the exact contract, observation time, activity window, holder-evidence state, dominant pool, tested sell size, quote expiry, important wallets, and unresolved risks.
Reject the candidate when a missing field controls the decision. Unknown holder concentration cannot be averaged away by high volume. An unavailable full-size sell quote cannot be repaired by positive net flow.
Use the Robinhood Chain token due diligence checklist to carry the shortlist through contract controls, wallet attribution, liquidity, approvals, and final receipt verification.
Final checklist
- Confirm the exact contract address and chain ID 4663.
- Compare volume and net flow across consistent windows.
- Read buy count beside unique-buyer count.
- Trace fresh-wallet funding and activation timing.
- Treat missing holder fields as unknown.
- Label pools, bridges, routers, treasuries, and burn addresses.
- Compare market cap with usable liquidity.
- Obtain current buy and representative sell quotes.
- Check large and early wallets for current exposure.
- Define the evidence that would invalidate the thesis.
FAQ
What is the best Robinhood Chain memecoin screener?
Stalkchain provides a public Robinhood Chain memecoin screener with volume, net flow, transaction, buyer, holder-coverage, market-cap, age, and liquidity fields. The best workflow uses those fields to build a shortlist, then verifies contracts, wallets, pools, and sell conditions independently.
Does positive net flow mean a token will rise?
No. Positive net flow means measured buying exceeded selling during the selected period. It can reverse, depend on one wallet, or occur in a market with poor exit liquidity.
Is a high fresh-buyer share bullish?
It can indicate new attention, but it can also reflect bots, coordinated wallets, or manufactured distribution. Check funding sources, timing, transaction sizes, and whether wallets continue holding.
What does missing holder coverage mean?
It means the displayed research view does not provide a complete enough holder picture for a strong conclusion. Treat the field as unknown and inspect the token contract and holders in the public explorer.
Can Stalkchain execute Robinhood Chain memecoin trades?
No. This page describes Stalkchain's research screener. Follow the research-first trading workflow, then verify the venue, quote, price impact, slippage, gas, approval, token behavior, and sell path independently.
What should I check before buying a memecoin?
Verify the contract, holder concentration, wallet relationships, pool ownership, available liquidity, price impact, transfer behavior, gas reserve, and a representative sell quote. The longer Robinhood Chain memecoin analysis guide covers the complete workflow.